2018 was a great for venture capital investment and many were still not sure if this is the new standard in terms of VCs pouring money into innovative startups. At the beginning of 2019, many in the VC industry predicted that activity would slow down. Now that 2019 is behind us, we decided to explore the data to examine the structural changes happening to the venture landscape. One aspect is clear on the deal size front that there were large deals in every stage of investment process in 2019. Mega-rounds ($100M+) and mega-funds ($500M+) made stories in addition to exciting exits by industry altering startups - record-breaking exit value of over $250B, nearly 80% of which came from VC-backed IPOs. Going into 2019, everybody had expectation that there will be unicorn IPOs, but few expected that the post IPO performances of some listings would be choppy. Several well-known companies were severely challenged by the public market on the fundamentals (profits, corporate governance, strategy) of their business operation. We expect such scrutiny to continue into 2020 and since there are some large VC backed companies in the pipeline, we will not be surprised if they stay private funding by taking more late stage funding to avoid the uncertainties. Although LPs will see high level of liquidity in 2020, we also expect there will be more scrutiny on first time funds and some pullback on allocation to VC funds by LPs. 2019 provides some confirmation about the structural changes shaping the venture industry from increasing influence of nontraditional VC investors such as sovereign wealth funds and PE funds.
GLOBAL VC LANDSCPE: Global VC funding remains high in 2019 although total VC investment fell sharply from 2018 levels of $302B (Source: KPMG)

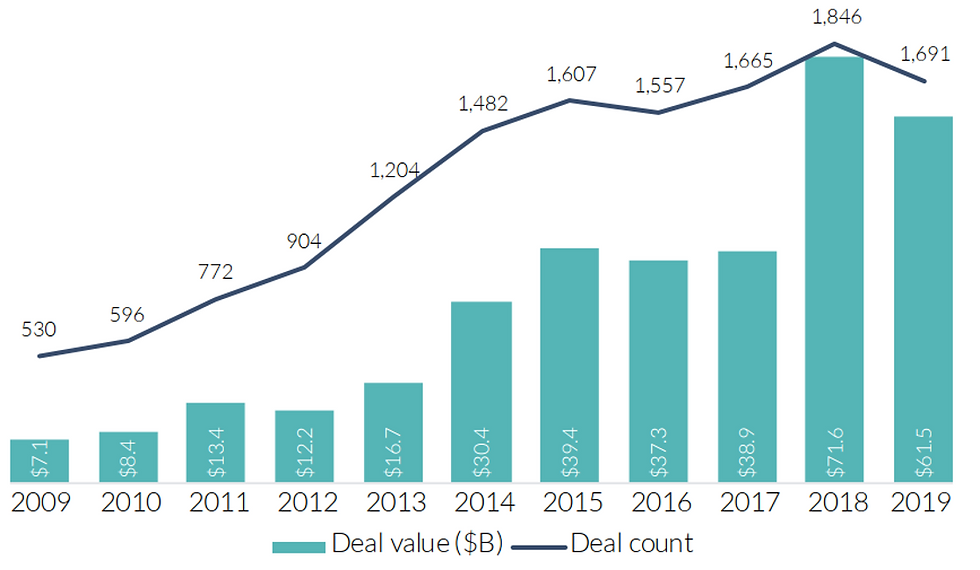
US DEAL ACTIVITY: 2019 US VC deal count and value continued into record territory with large available capital driving up both deal sizes and startup valuations across nearly all stages (Source: Pitchbook)

US DEAL ACTIVTY: US VC activity in Q4 2019 slowed down w.r.t. deal count across all stages (Source: Pitchbook)

US DEAL ACTIVITY: The number of US unicorns sets new high (Source: PWC MoneyTree)

US DEAL ACTIVITY: Total value of US unicorns remains near-record highs in Q4’19 (Source: PwC MoneyTree)

Early-stage deal sizes hit unprecedented level; Valuations still rising (Source: Pitchbook)

US ANGEL & SEED ACTIVTY: 2019 Angel and seed deal value in US was in line with 2018’s record - $9.1B in deal value. Count, on the other hand, plateaued with 4,556 deals closed (Source: Pitchbook)

US EARLY STAGE ACTIVTY: With more than $42B invested across over 3,600 deals, 2019 neared 2018’s record highs for US early-stage VC investment (Source: Pitchbook)

US LATE STAGE ACTIVTY: Late-stage deal count in surpassed 2,500 for the first time ever in 2019, finishing the year at nearly 2,600 deals totaling more than $85B invested (Source: Pitchbook)

CVC DYNAMICS: In 2019, CVCs participated in almost 1,700 transactions, highlighting how important corporations now consider startup investment to their overall growth strategy (Source: Pitchbook)

US LIQUIDITY / EXITS: 2019 now stands as the annual record for US VC exit value at $256.4B across 882 liquidity events (Source: Pitchbook)

US LIQUIDITY / EXITS: IPO activity continues to climb in 2019 (Source: PwC MoneyTree)

US LIQUIDITY / EXITS: 649 buyouts in US make 2019 the second busiest M&A year ever (Source: PwC MoneyTree)

US LIQUIDITY / EXITS: IPO and M&A time-to-exit fall in Q4’19 (Source: PwC MoneyTree)

FUNDRAISING: In 2019, capital raised for US venture funds reached $46.3B, marking the second highest annual total in the past decade, but posting well below the $58B raised in 2018 (Source: Pitchbook)

FUNDRAISING: The annual median fund size reached $78.5M in 2019 as LPs have crowded capital into funds managed by VCs with successful track records (Source: Pitchbook)

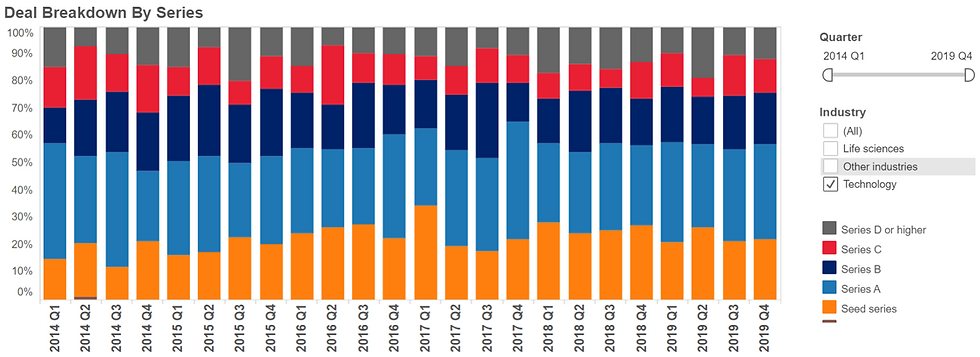
DEAL ECONOMICS: Seed deals were low (~20%) throughout all quarters of 2019 (Source: Cooley)

DEAL ECONOMICS: Number of startups with Pre-Money > $100M came down in Q4, but 2019 overall experienced higher % of UP rounds compared to prior year (Source: Cooley)

DEAL ECONOMICS: 2019Q4 Median Pre-Money valuations in technology sector: Seed $11M, S-A $30M, S-B $82M, S-C $323M (Source: Cooley)

DEAL ECONOMICS: Liquidation Preference for <=1X remained steady at more than 95% of deals (Source: Cooley)

DEAL ECONOMICS: Deals with no Anti-Dilution protection increased in the last quarter of 2019 (Source: Cooley)

VENTURE FUND RETURNS: As of Sept 2019, 5-Year horizon pooled return of early stage venture funds had performed slightly better than some of the well-known public market indices (Source: Cambridge Associates)


Comments